
I led a design initiative to create a design system and portal experience to keep track of forklift information and help streamline Toyota Forklifts' business decisions related to their forklift operations.
I collaborated with our clients at Toyota to ensure alignment with business and user needs while meeting visual expectations throughout the entire design process.
Role: Lead designer
Responsibilities:
Discovery, workshopping, ideation and iteration,
end-to-end UI.UX,
visual quality analysis
Timeline: 6 months
Discovery
During the discovery phase, my design team and I interviewed customers and our client to understand the day-to-day of our dealers, stakeholders and customers.
Key findings
Manual exertion
Dealers manually had to look for data to make business decisions, making it difficult.

Unable to do multiple tasks
Dealers couldn't track their data and operations efficiently enough to streamline workflow.
Personalization
There was interest for insights based on existing data to help drive business decisions.
Goal
Create a design system and centralized portal where dealers can perform all necessary forklift tasks to help streamline business and customer goals.
Maximize forklift utilization
Dealers and customers wanted to make the most of their forklifts and use it as much and as efficiently as possible through its life cycle.

Better communication
Dealers wanted to improve customer satisfaction by being able to communicate more quickly and efficiently with them.
Lofi iteration
Before building out a design system, I wanted to understand what the portal would look like before applying any visual design.
I worked with an apprentice designer to create concept sketches and and wireframes for a rough idea of what the portal experience could look like.
Step 1
User flows
to understand all the pages and data tools needed for a robust portal experience.
Step 2
Concept sketches
to map out pages without getting into specifics and details of forklift info
Step 3
Wireframes
to plan out more specific details within each page and understand general layout
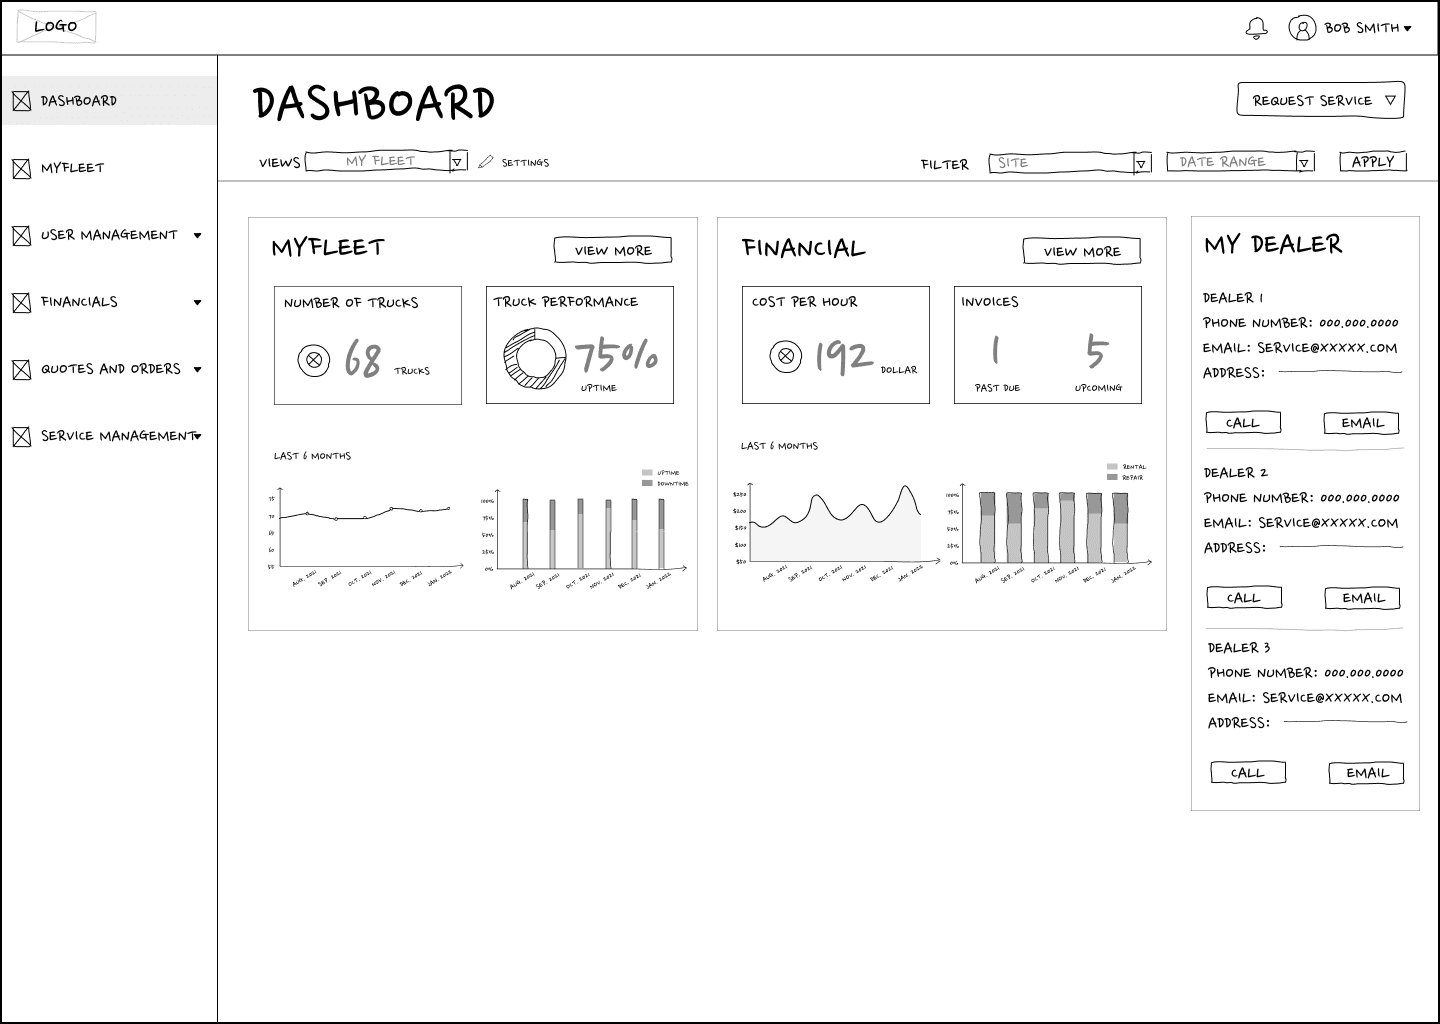
Dashboard concept sketch
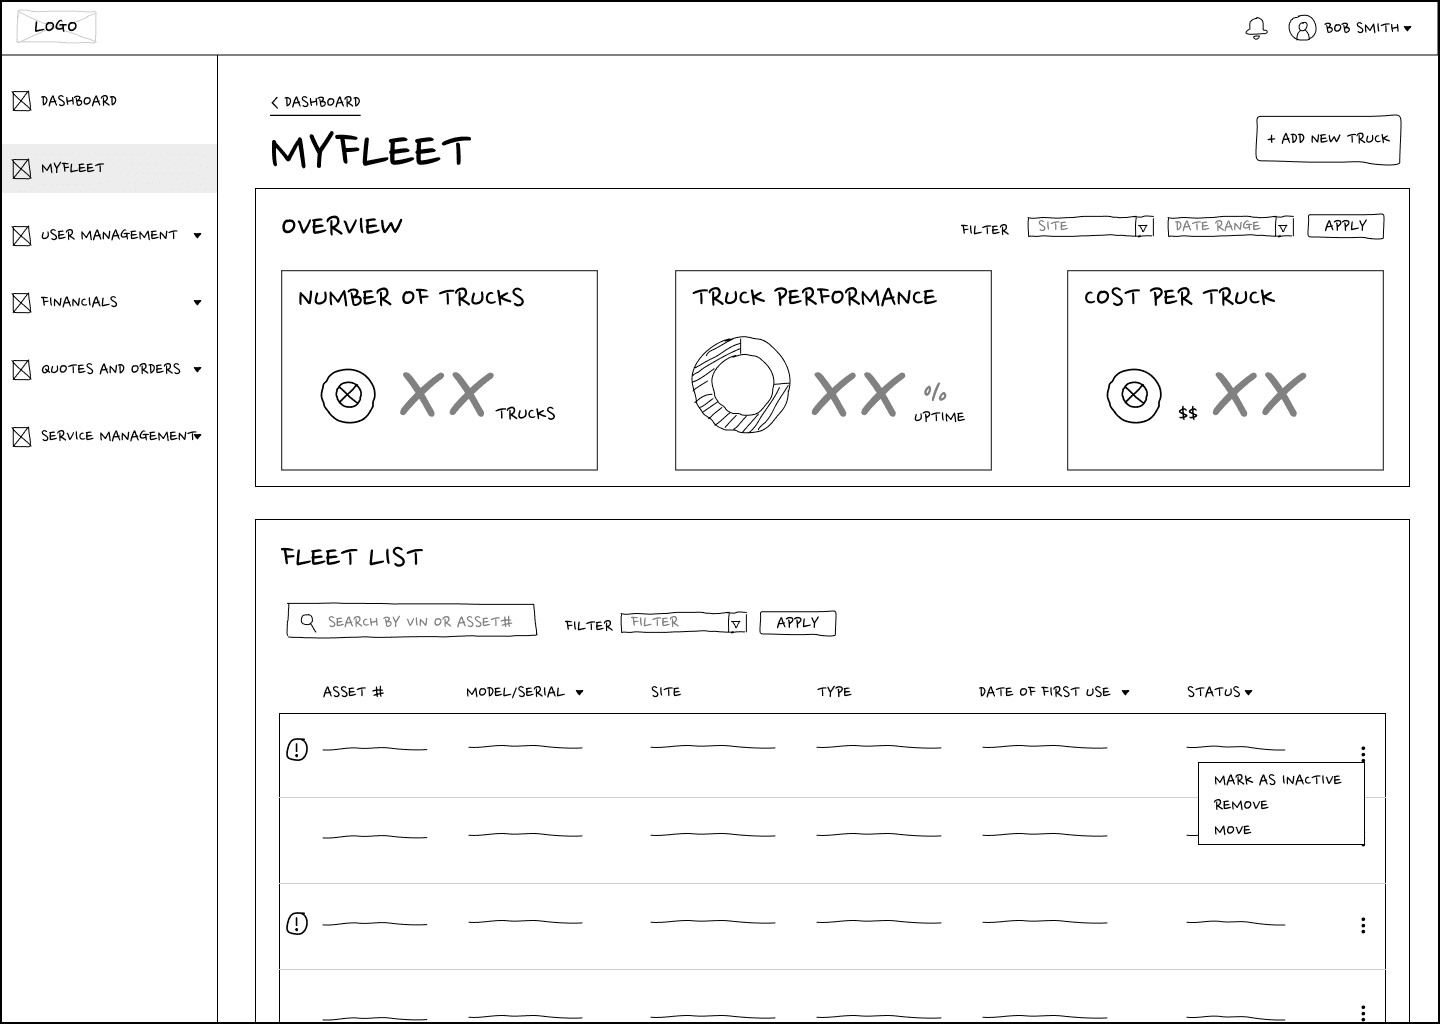
MyFleet concept sketch
Dashboard wireframe
MyFleet wireframe
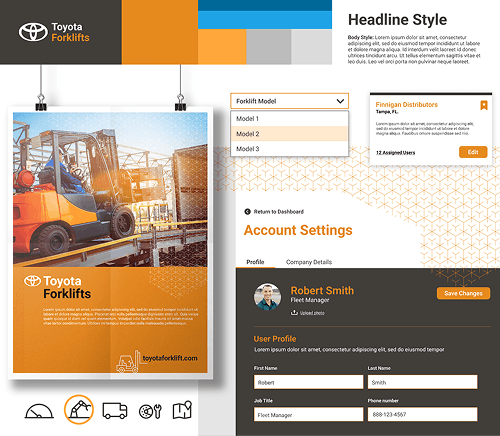
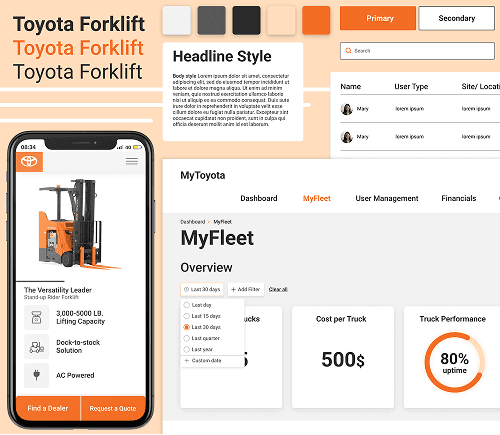
Visual design
To hone in on what look and feel our client wanted, I created 3 moodboards with another visual designer. Our client chose different elements from each moodboard to incorporate into the design styles that would make up the design system and portal.
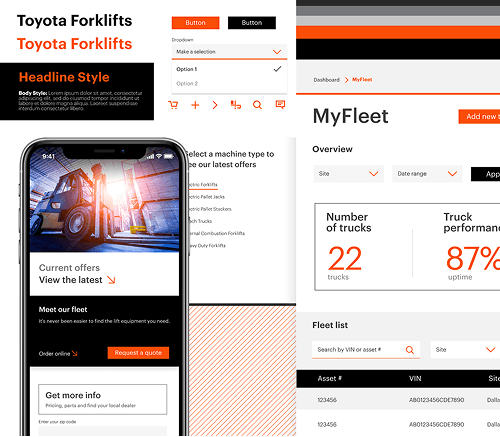
Visual consistency
Two workstreams, one design system
We had to take into account that another team was designing a marketing page that would align with the portal experience.
Thinking about accessibility
Choosing the right colors
We needed to make sure that the colors we chose would pass AA accessibility standards.
Moodboard 1
Moodboard 2
Moodboard 3
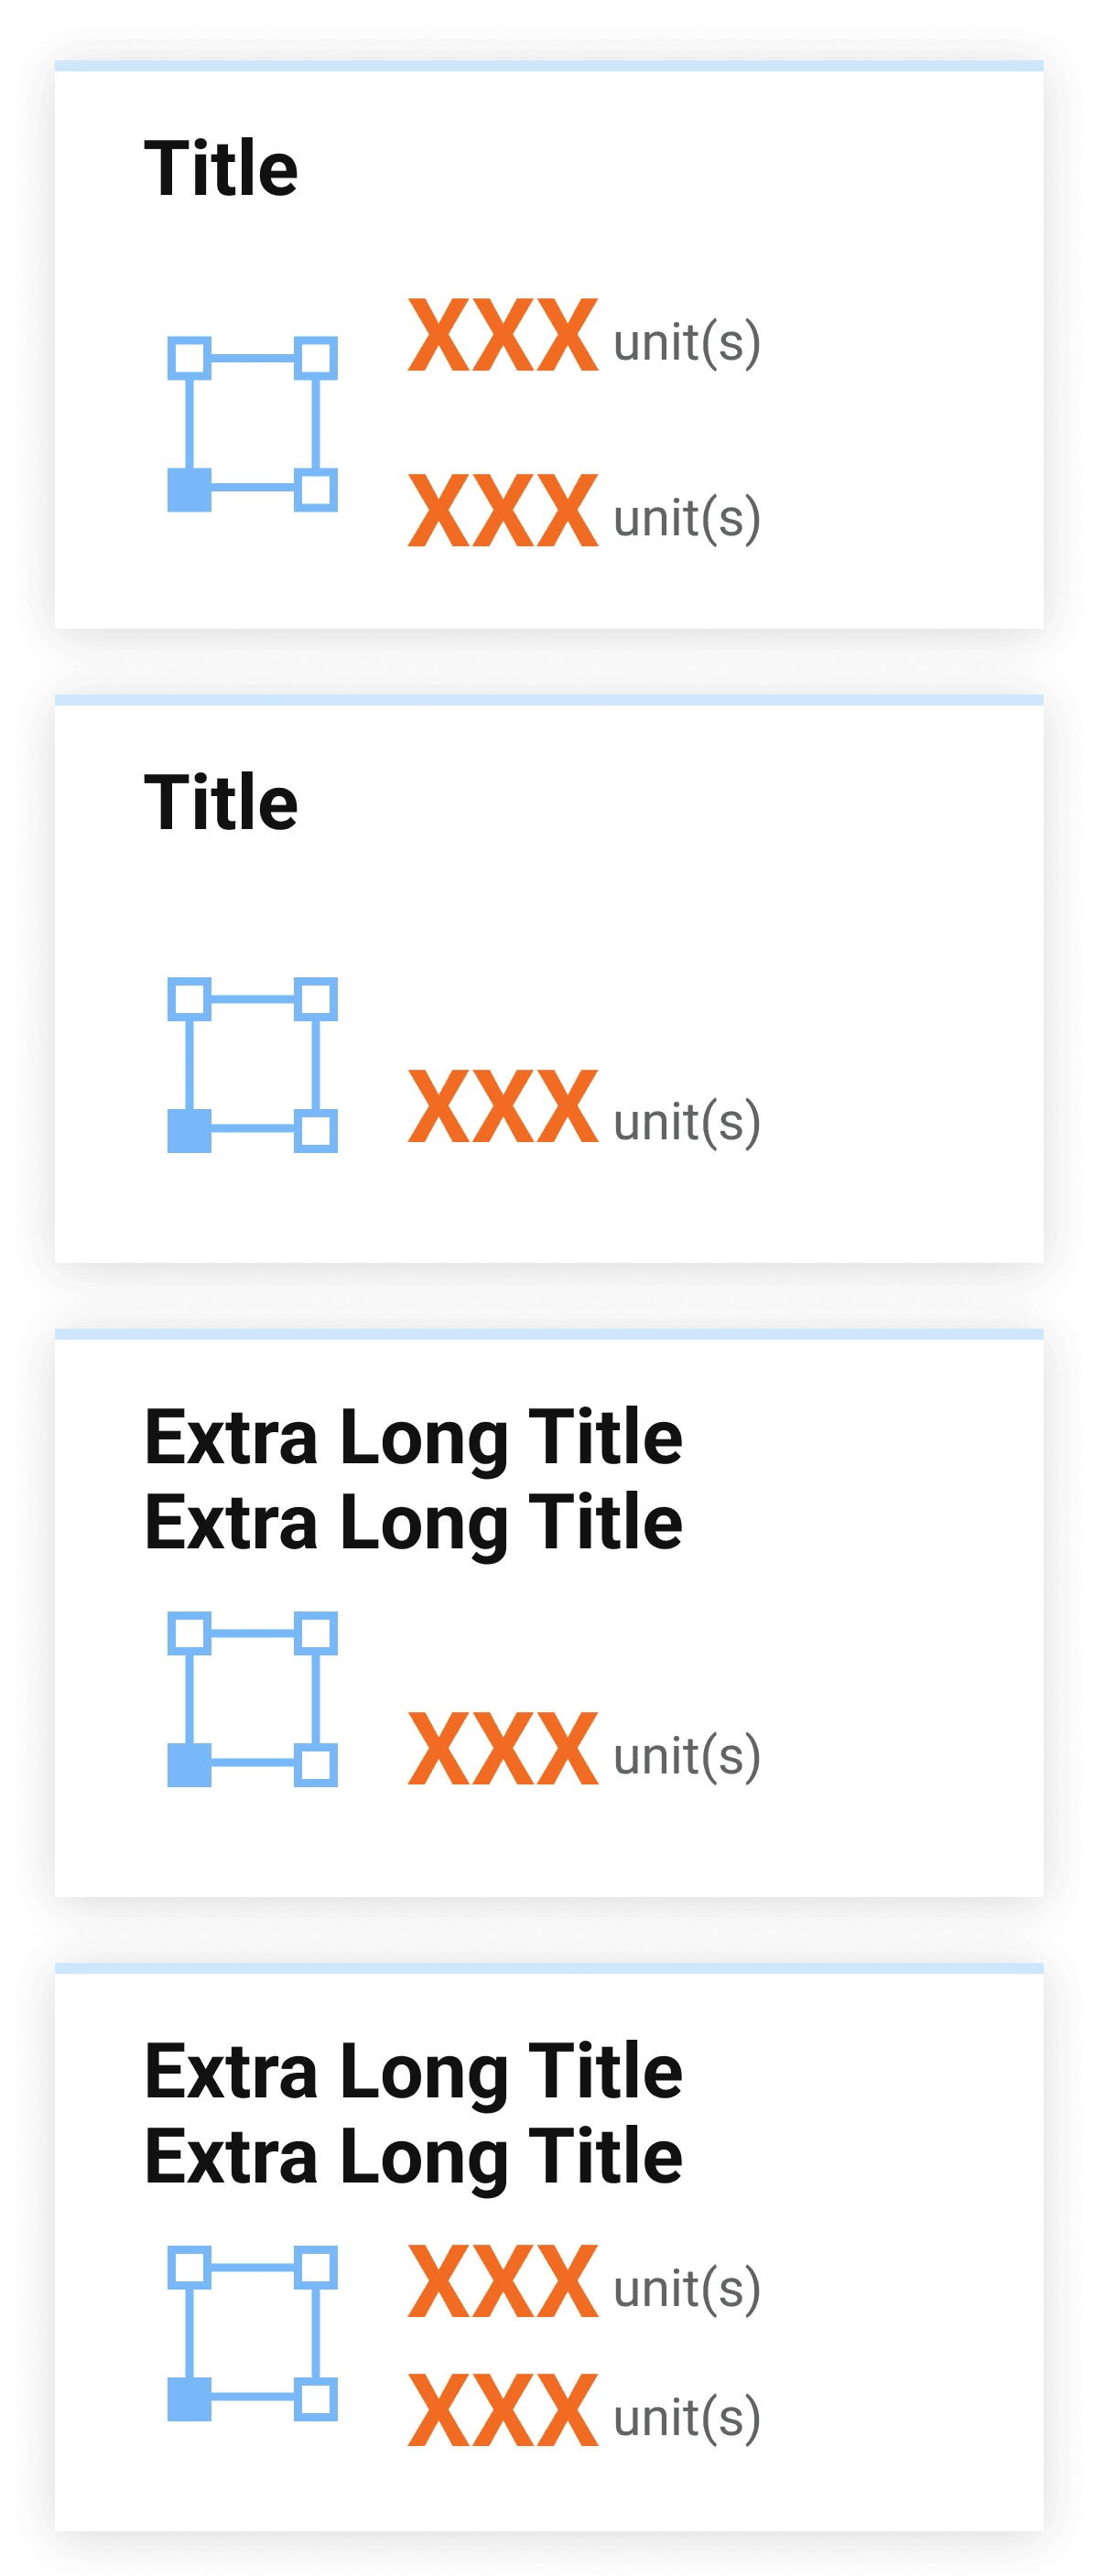
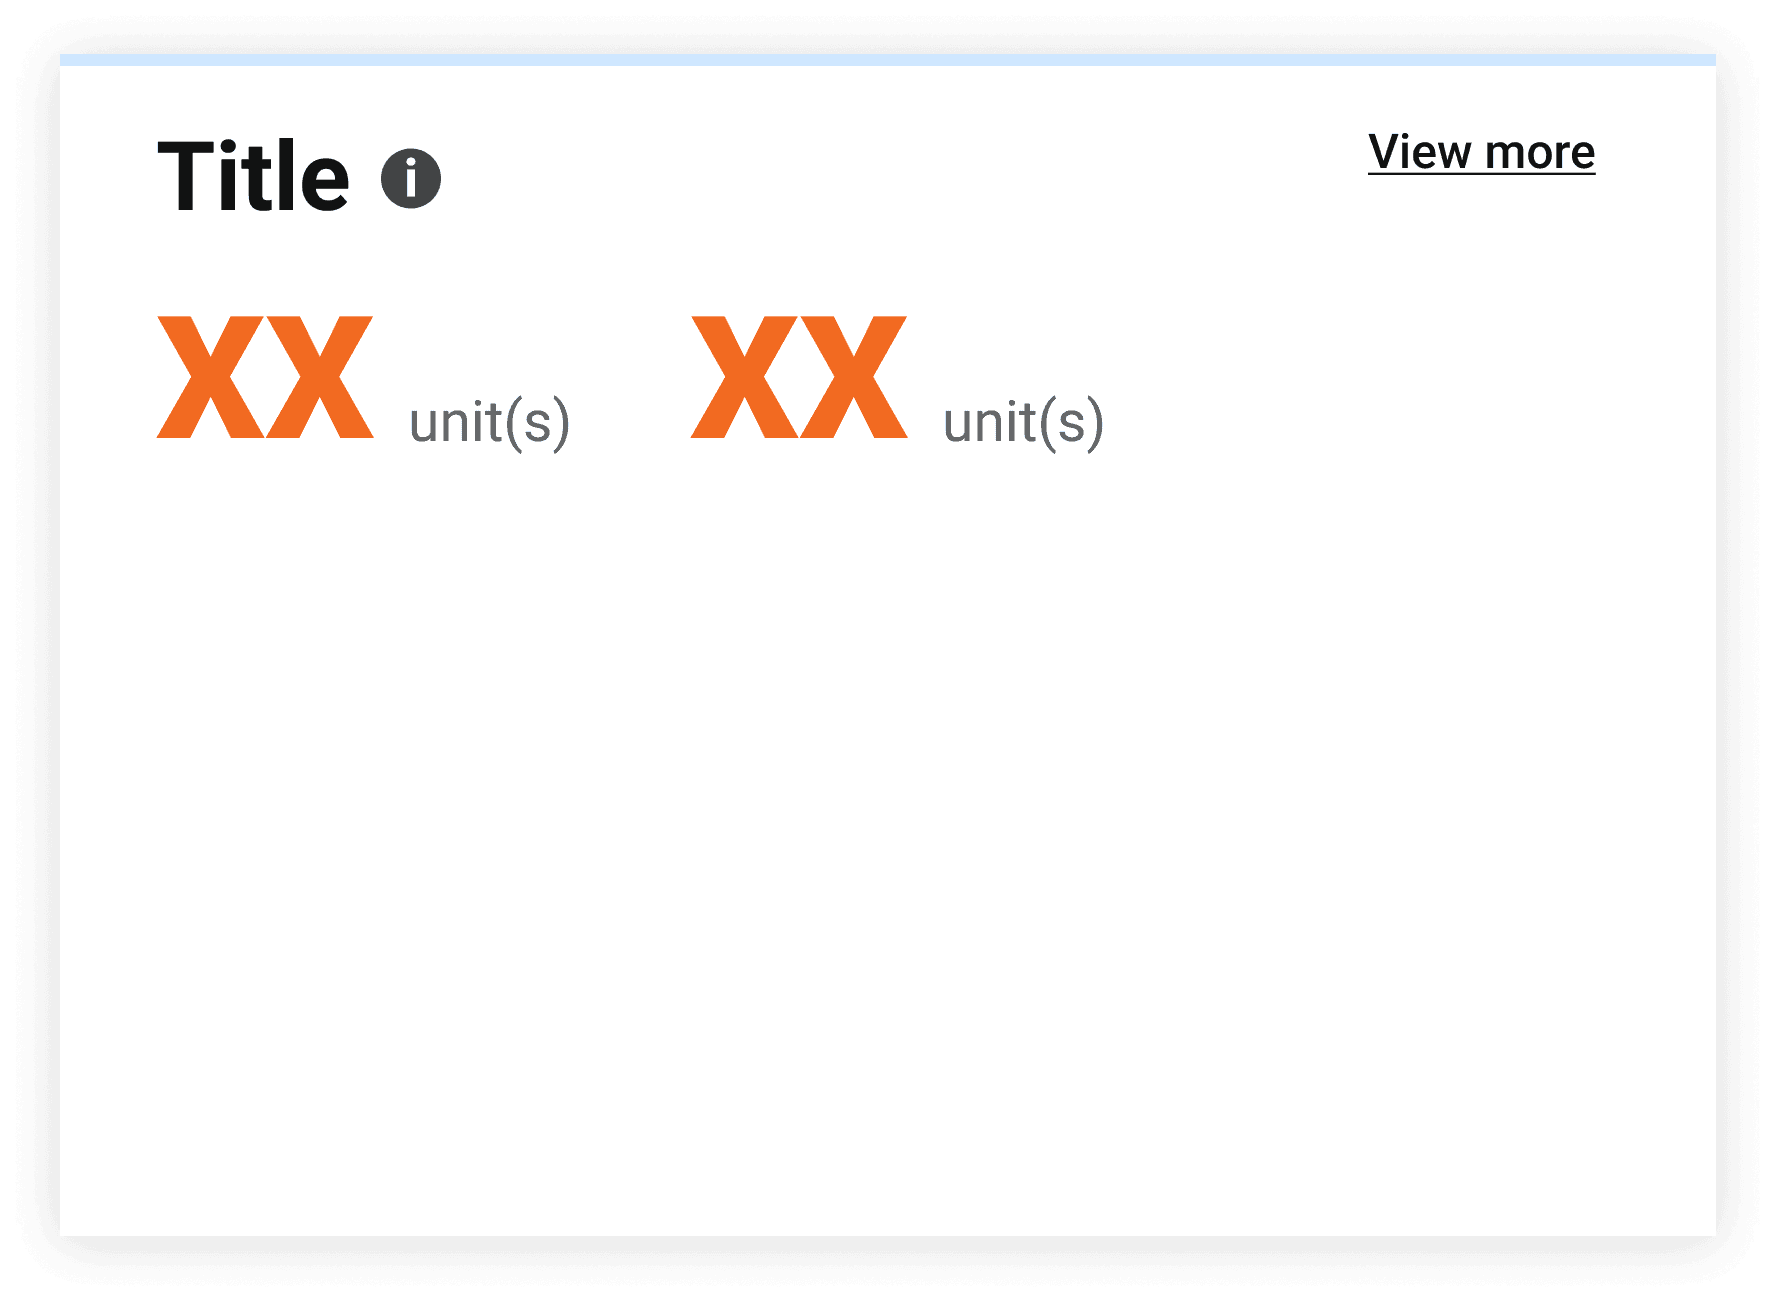
Design system
The design system was built out using the
Atomic Design Methodology
This allowed for scalability and a
seamless handoff to designers within
Toyota after the project was over.
We built out:
610 components
95 styles

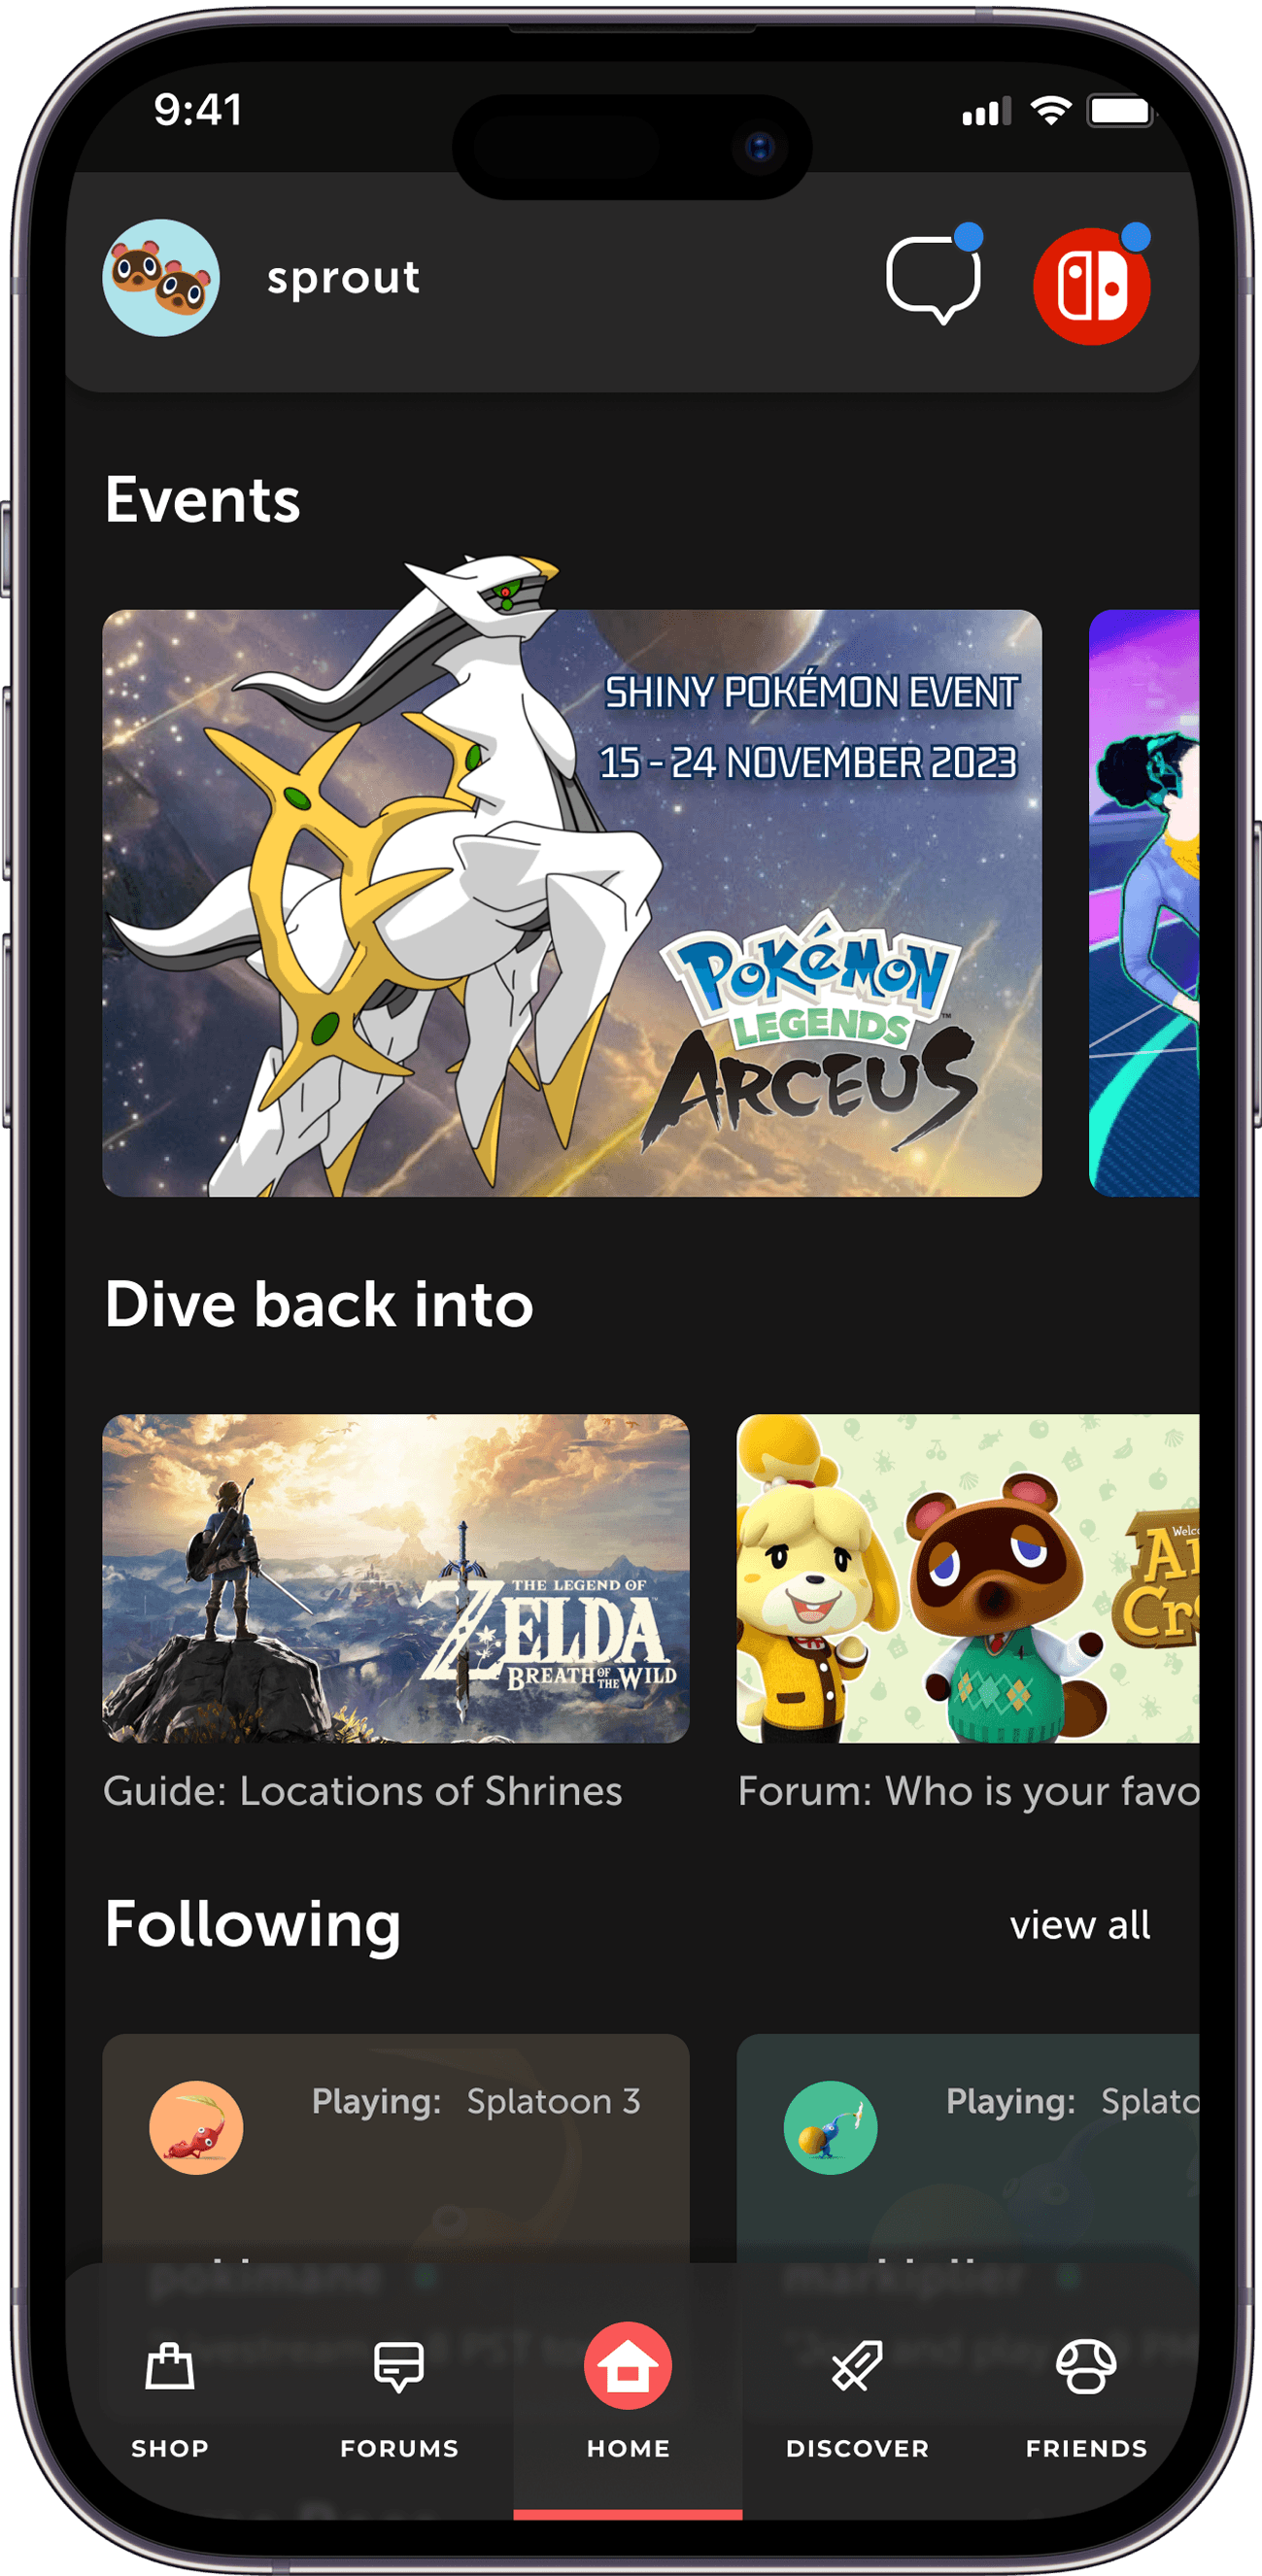
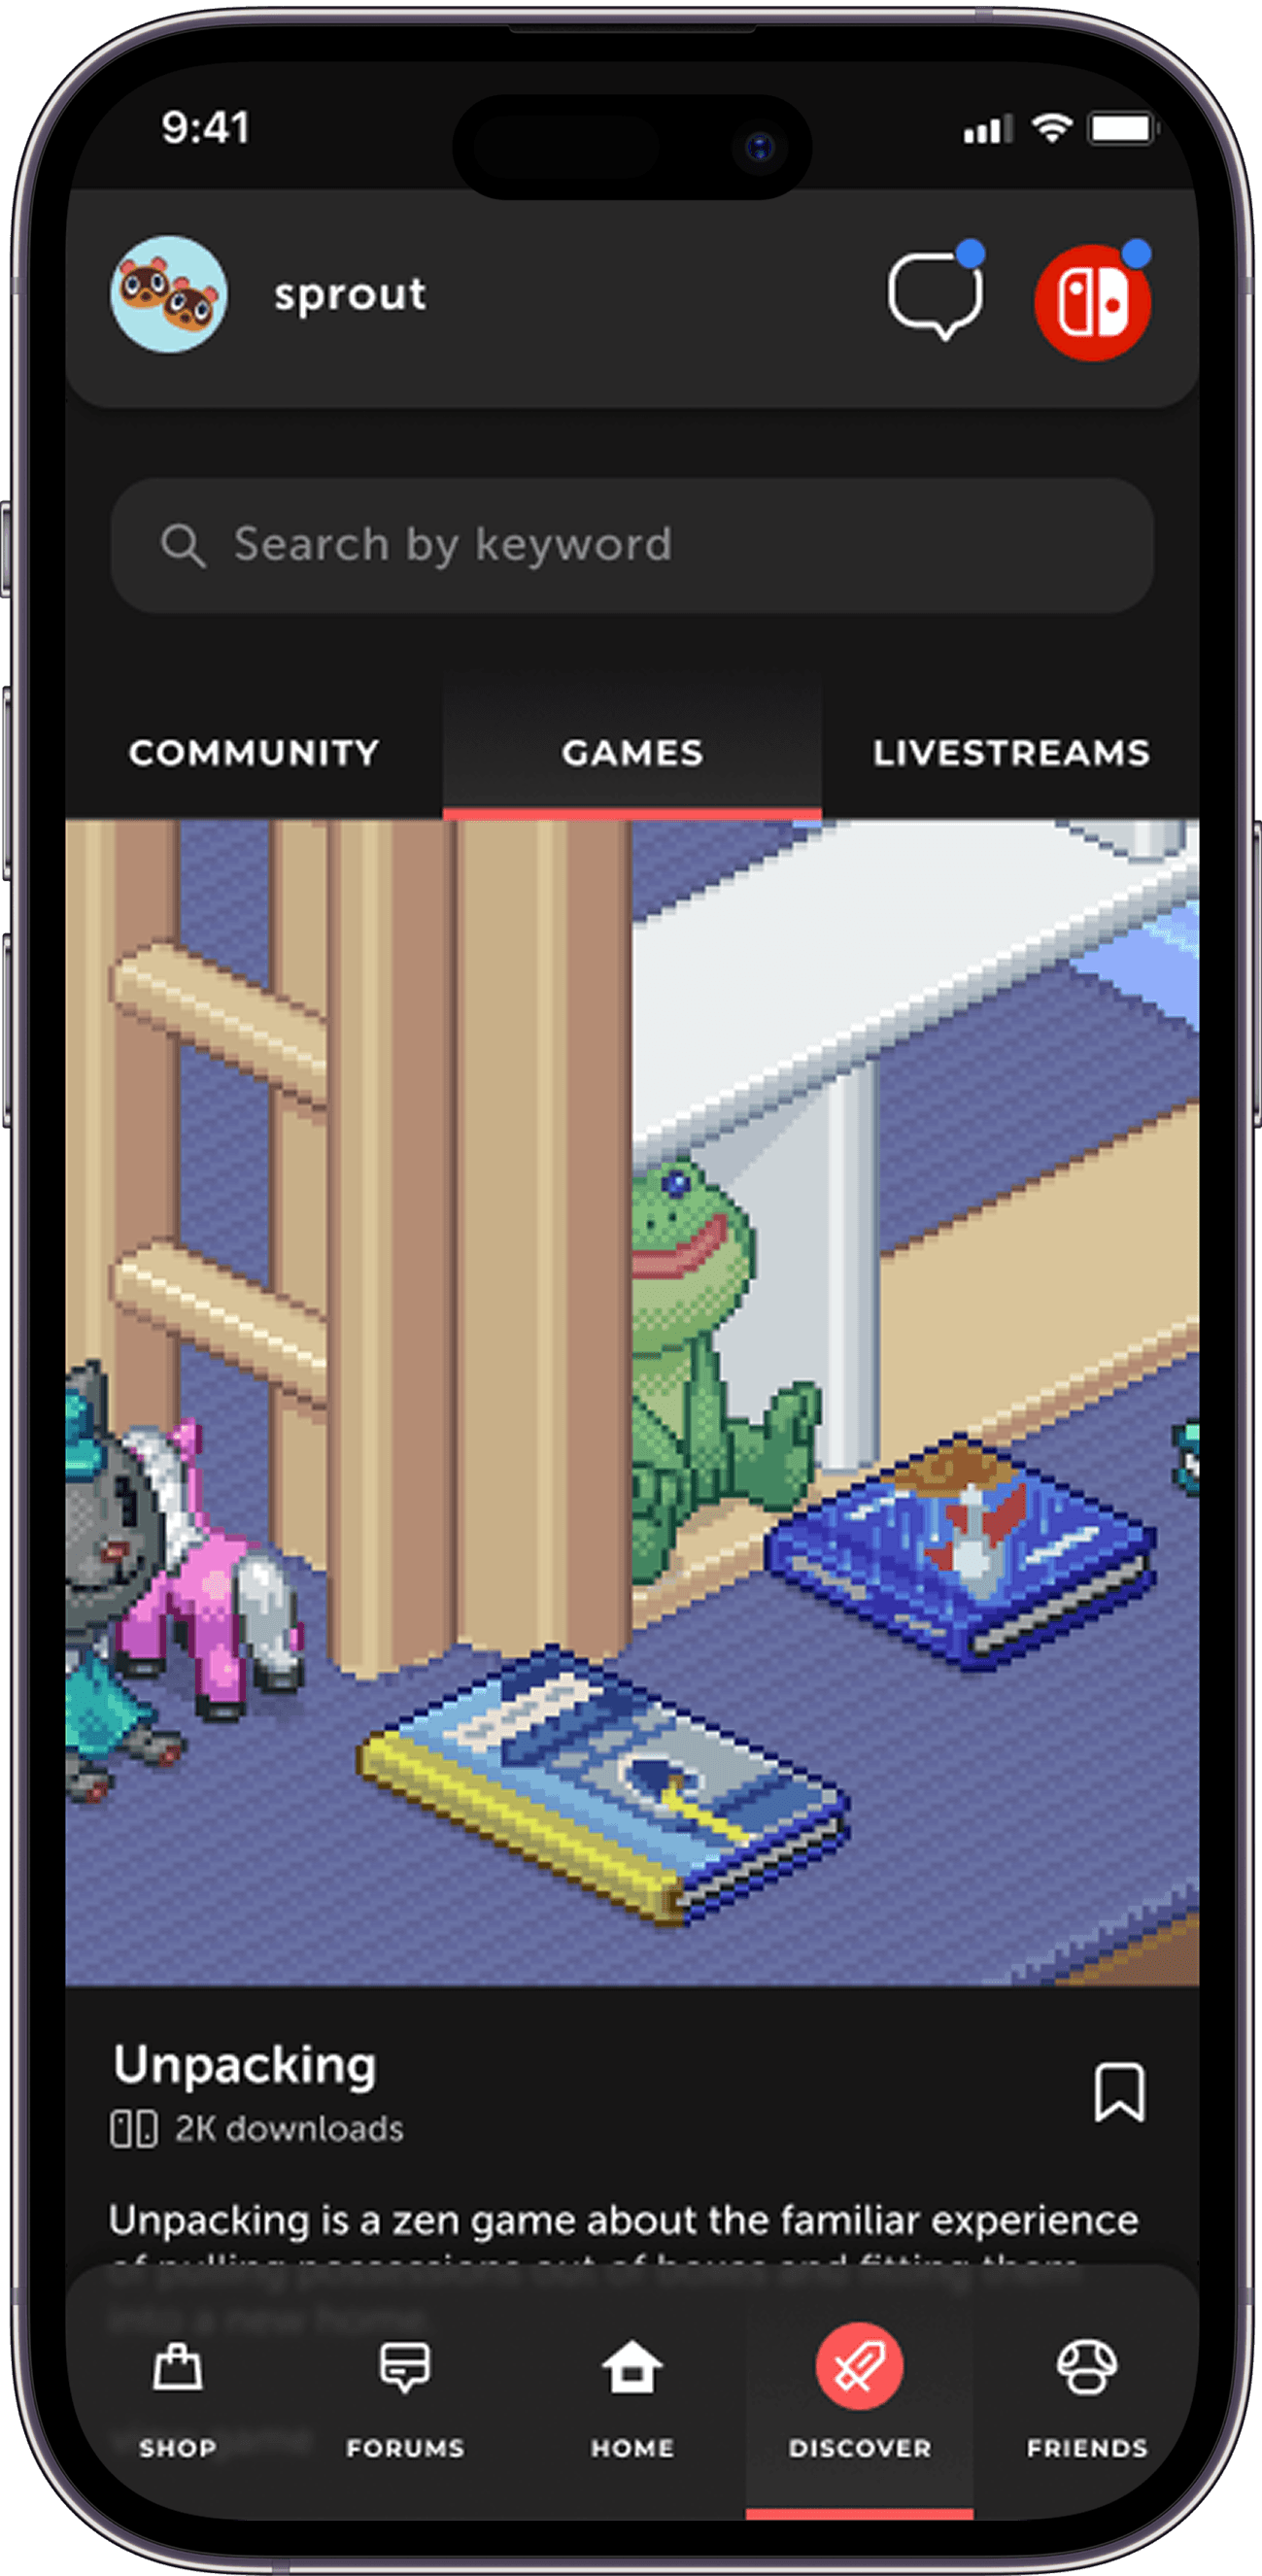
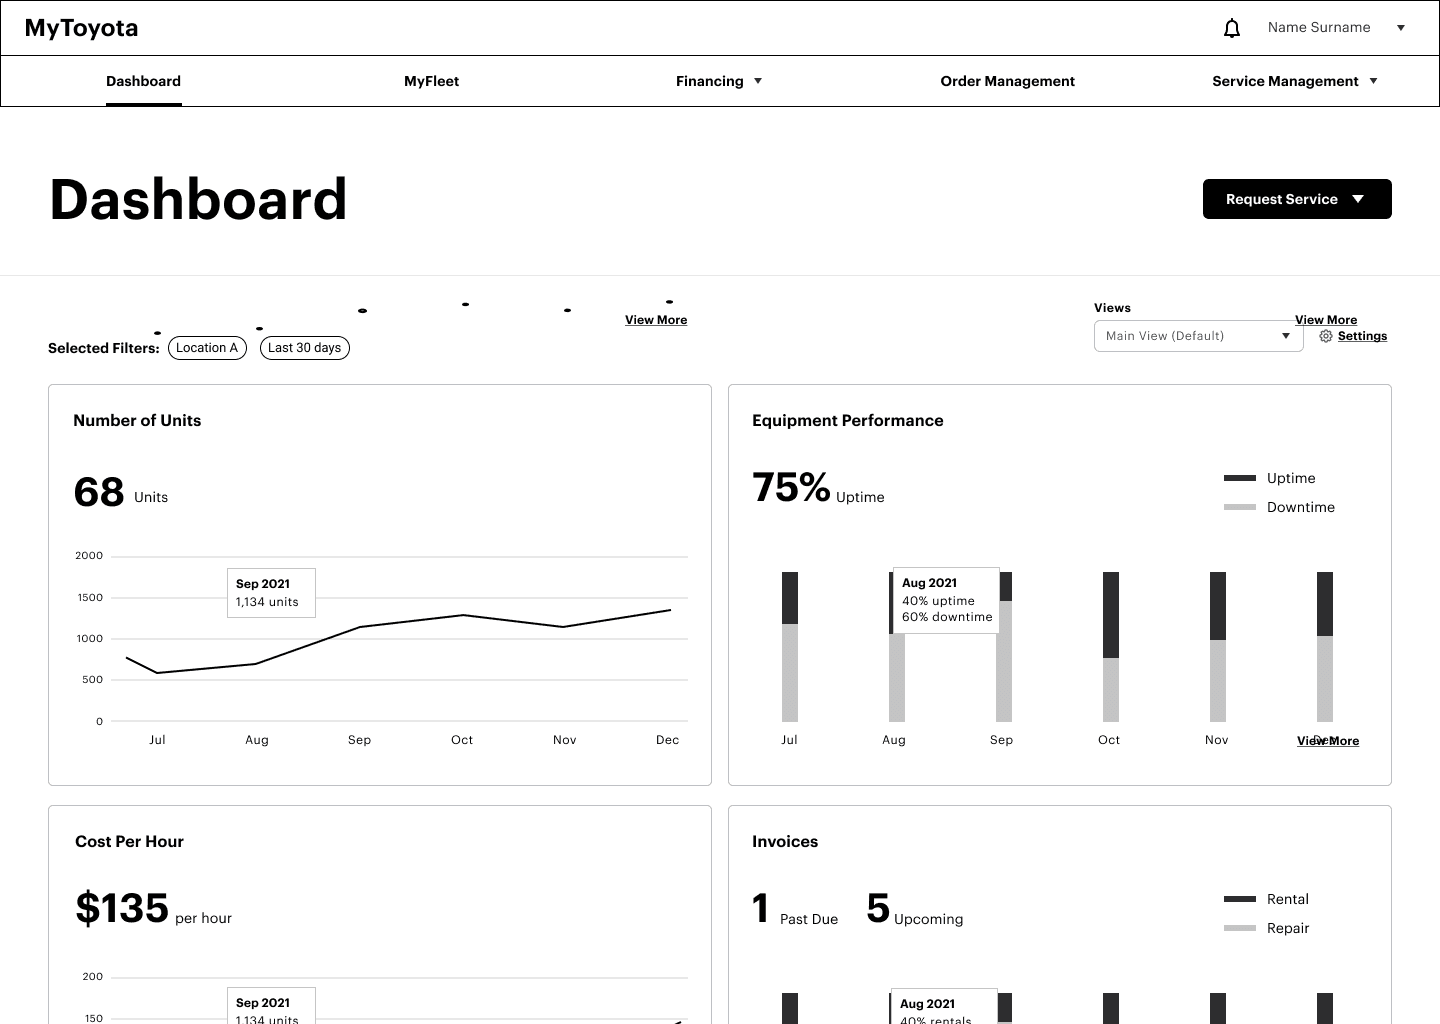
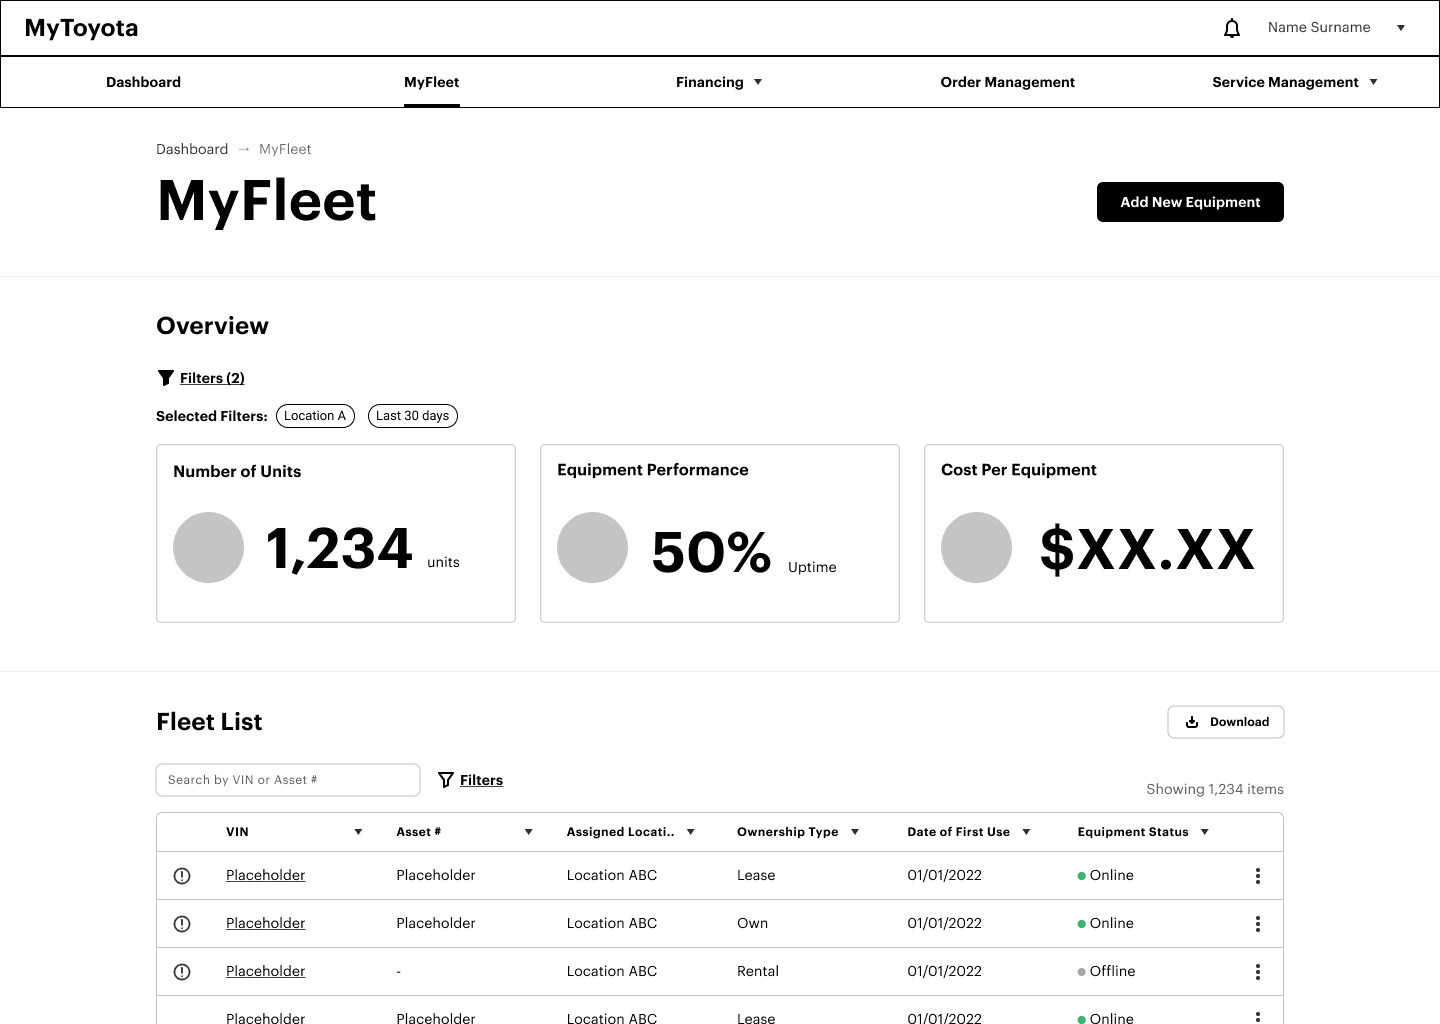
The portal experience
Through weekly design sprints and feedback sessions, my team and I designed a completely new portal experience that helped dealers and their customers view relevant forklift data, and perform business tasks that helped them excel and drive business decisions.
600+
screens designed
AA
accessible
3 screens
responsive across mobile, tablet + desktop
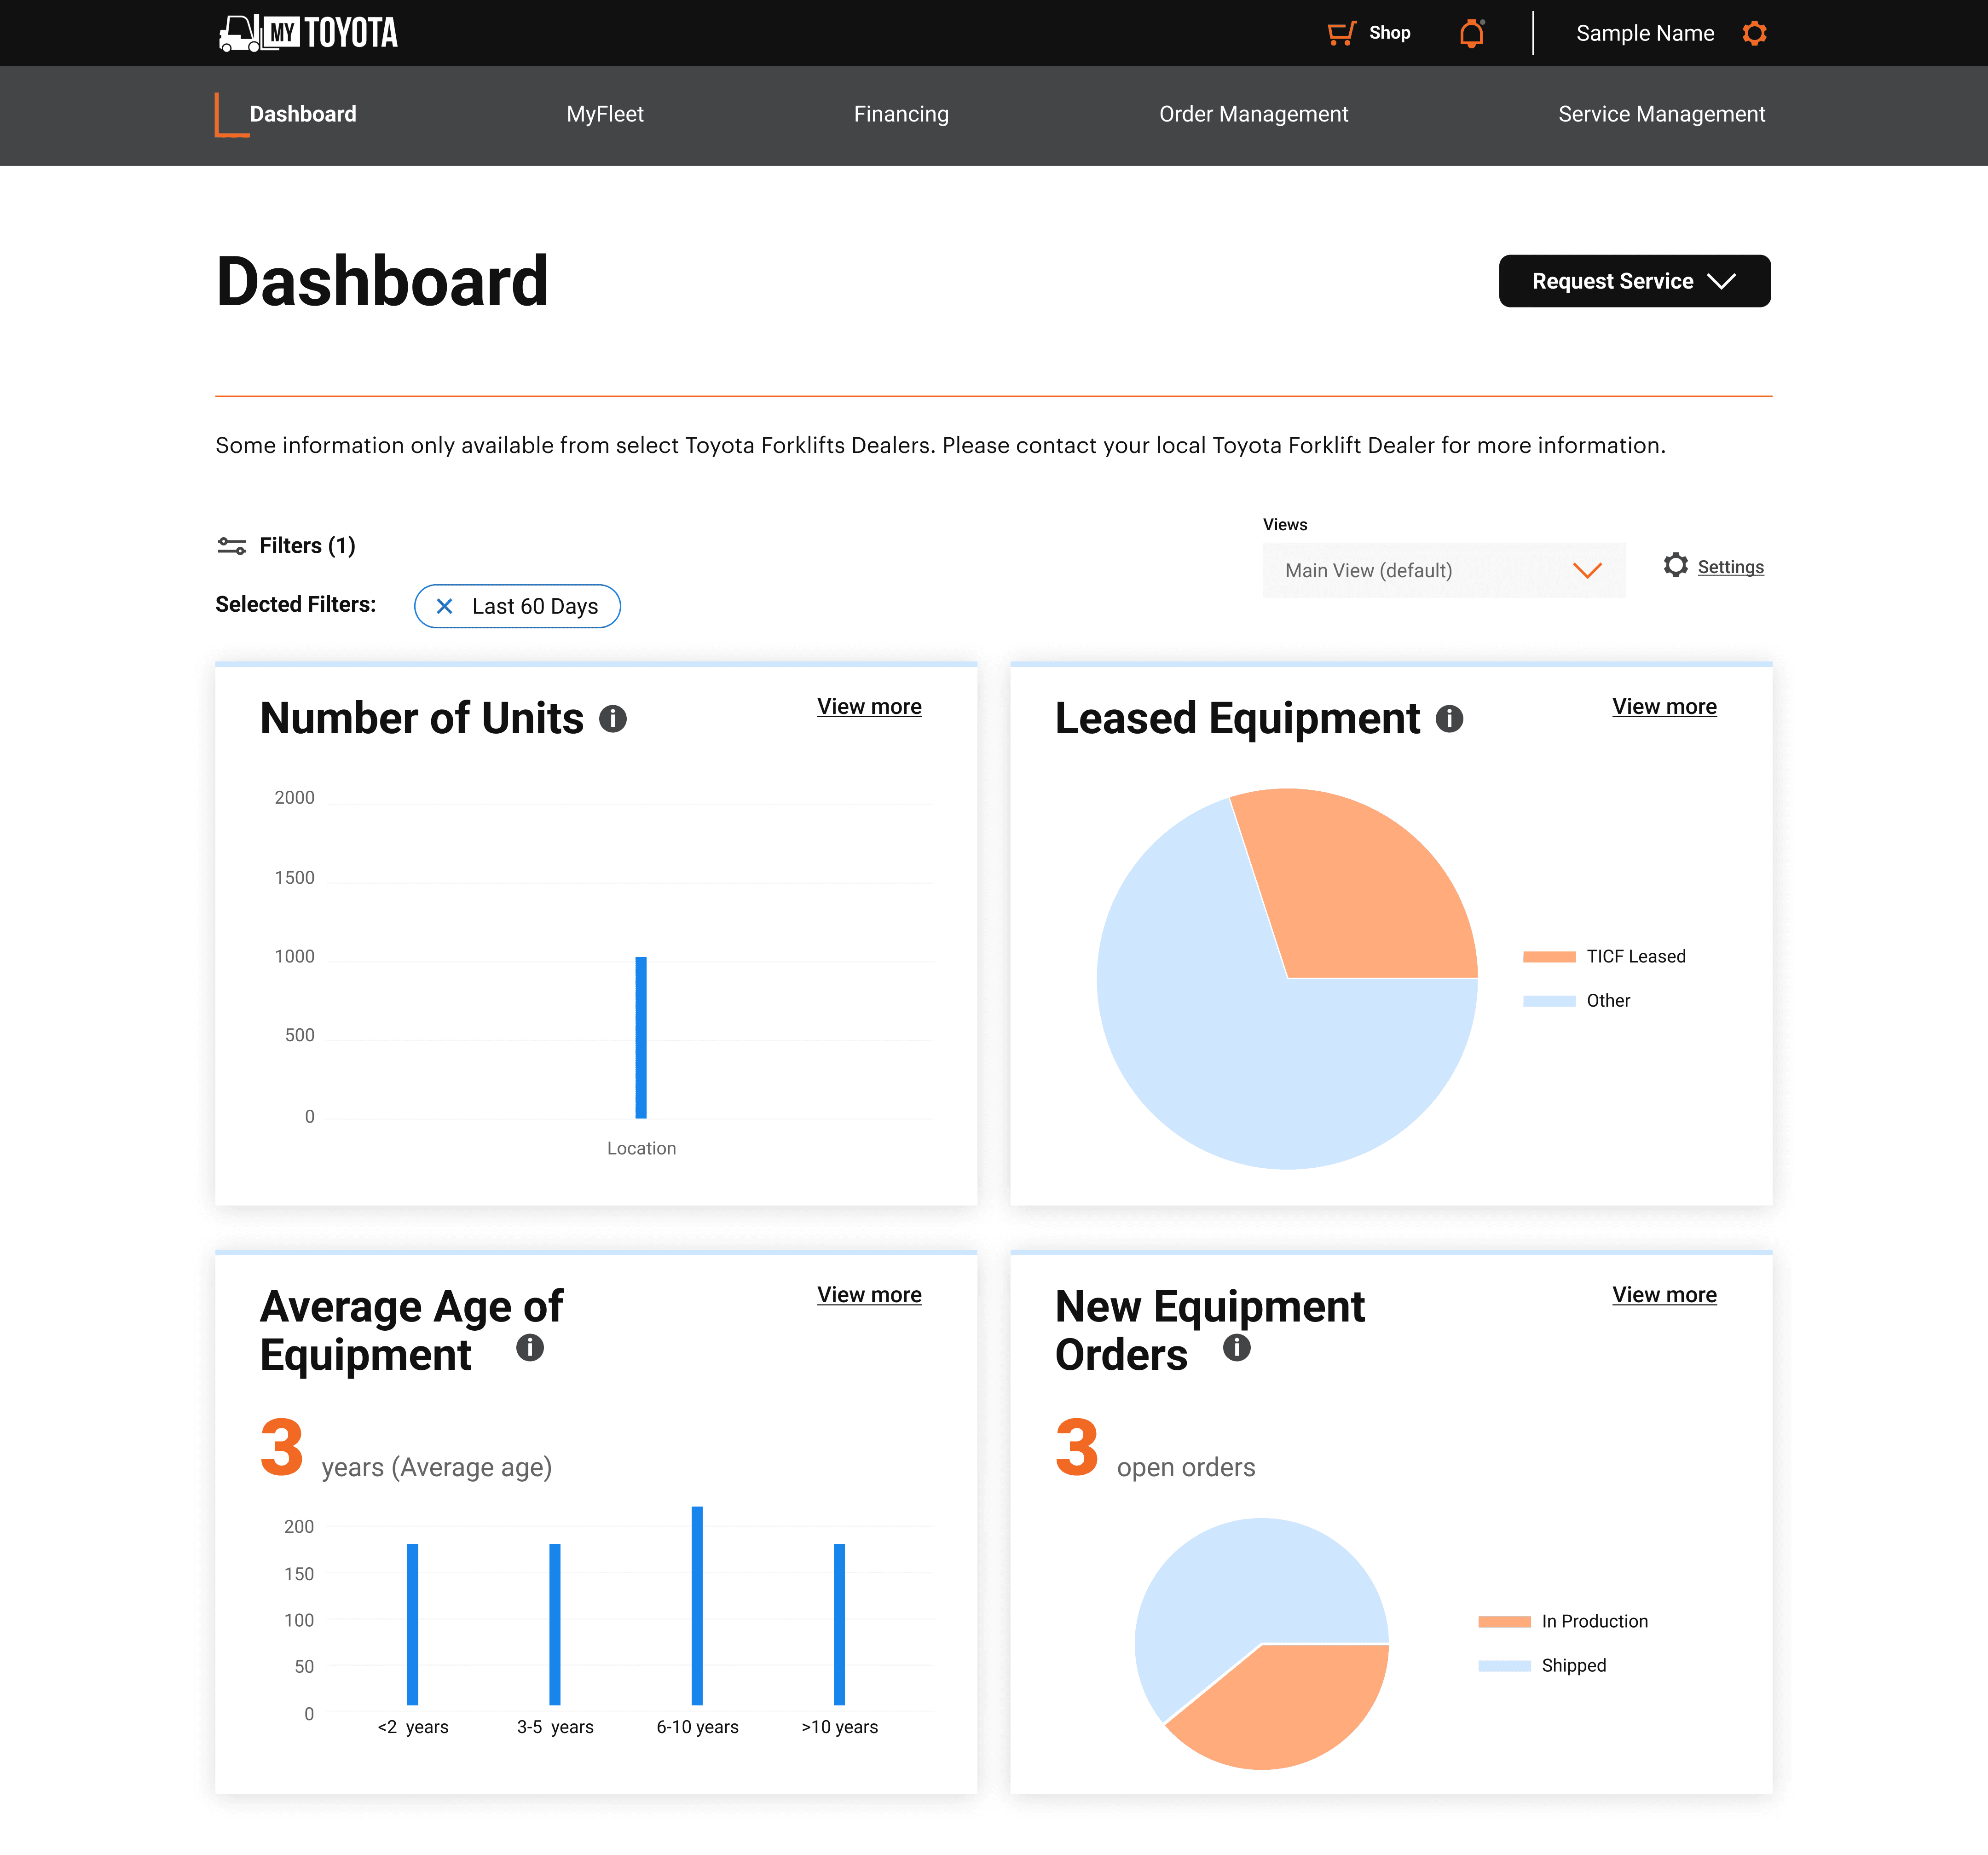
Dashboard
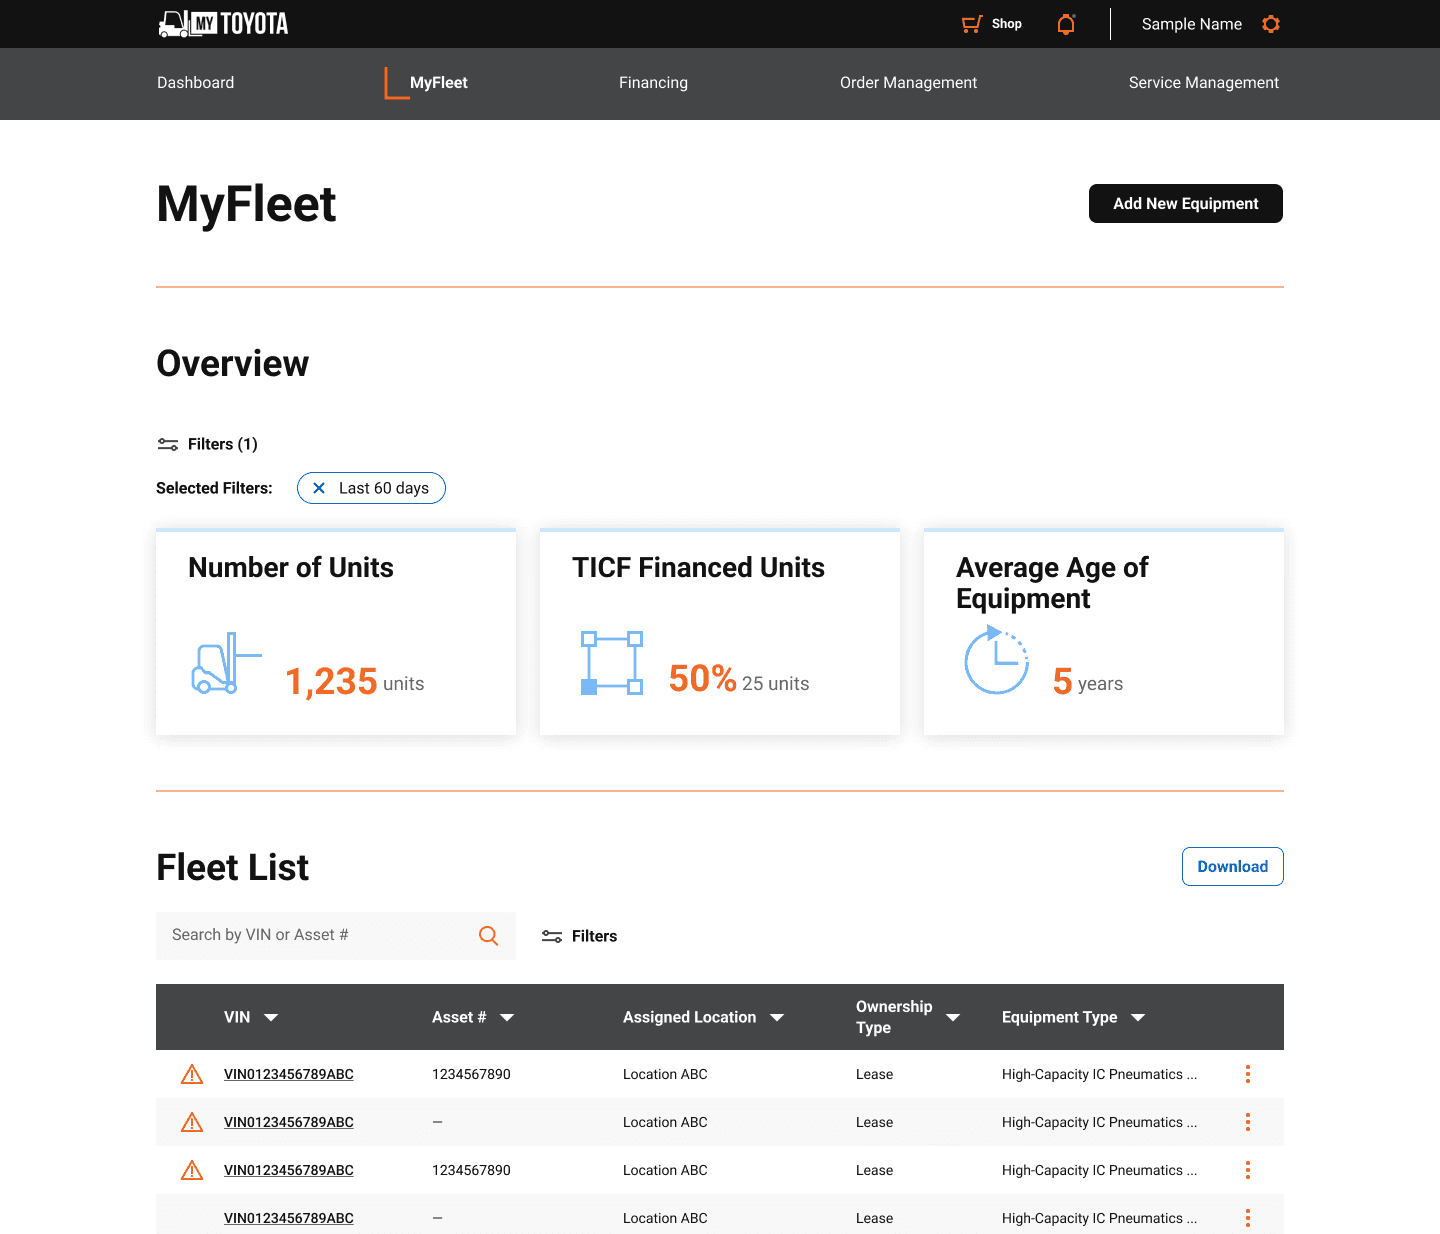
MyFleet
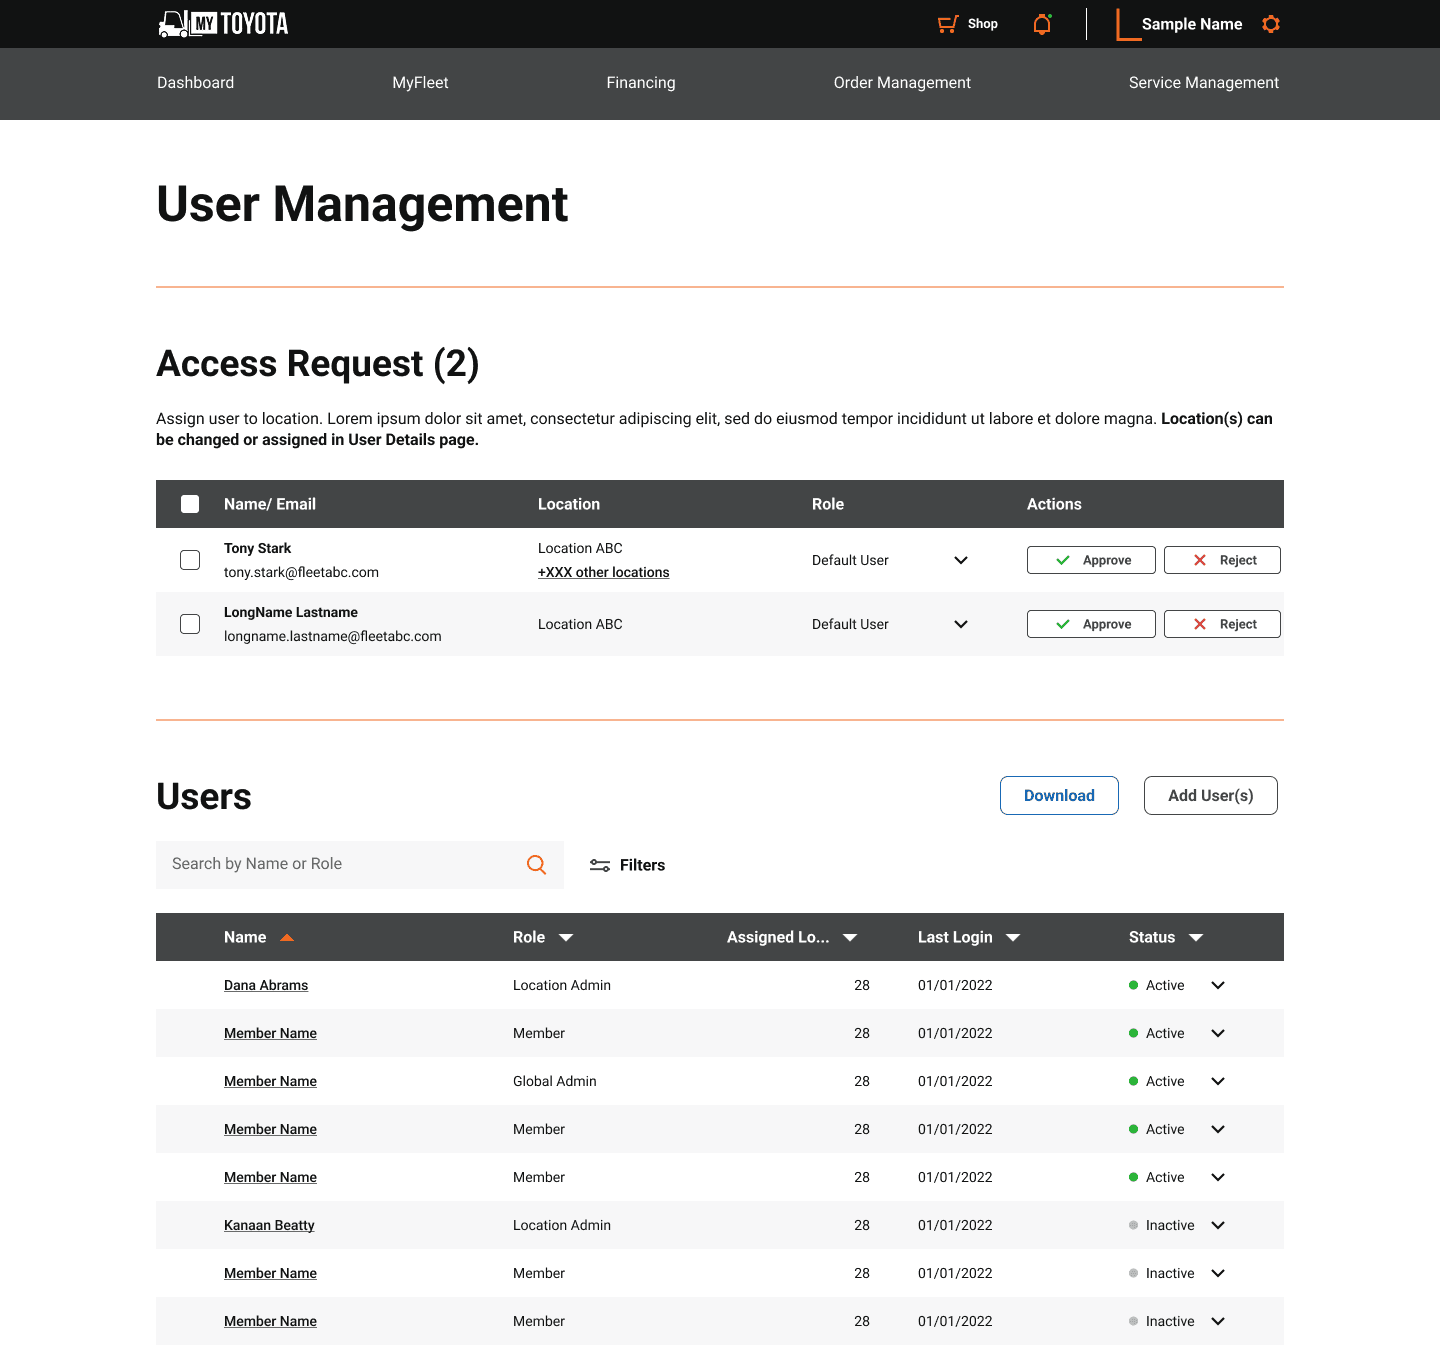
User management
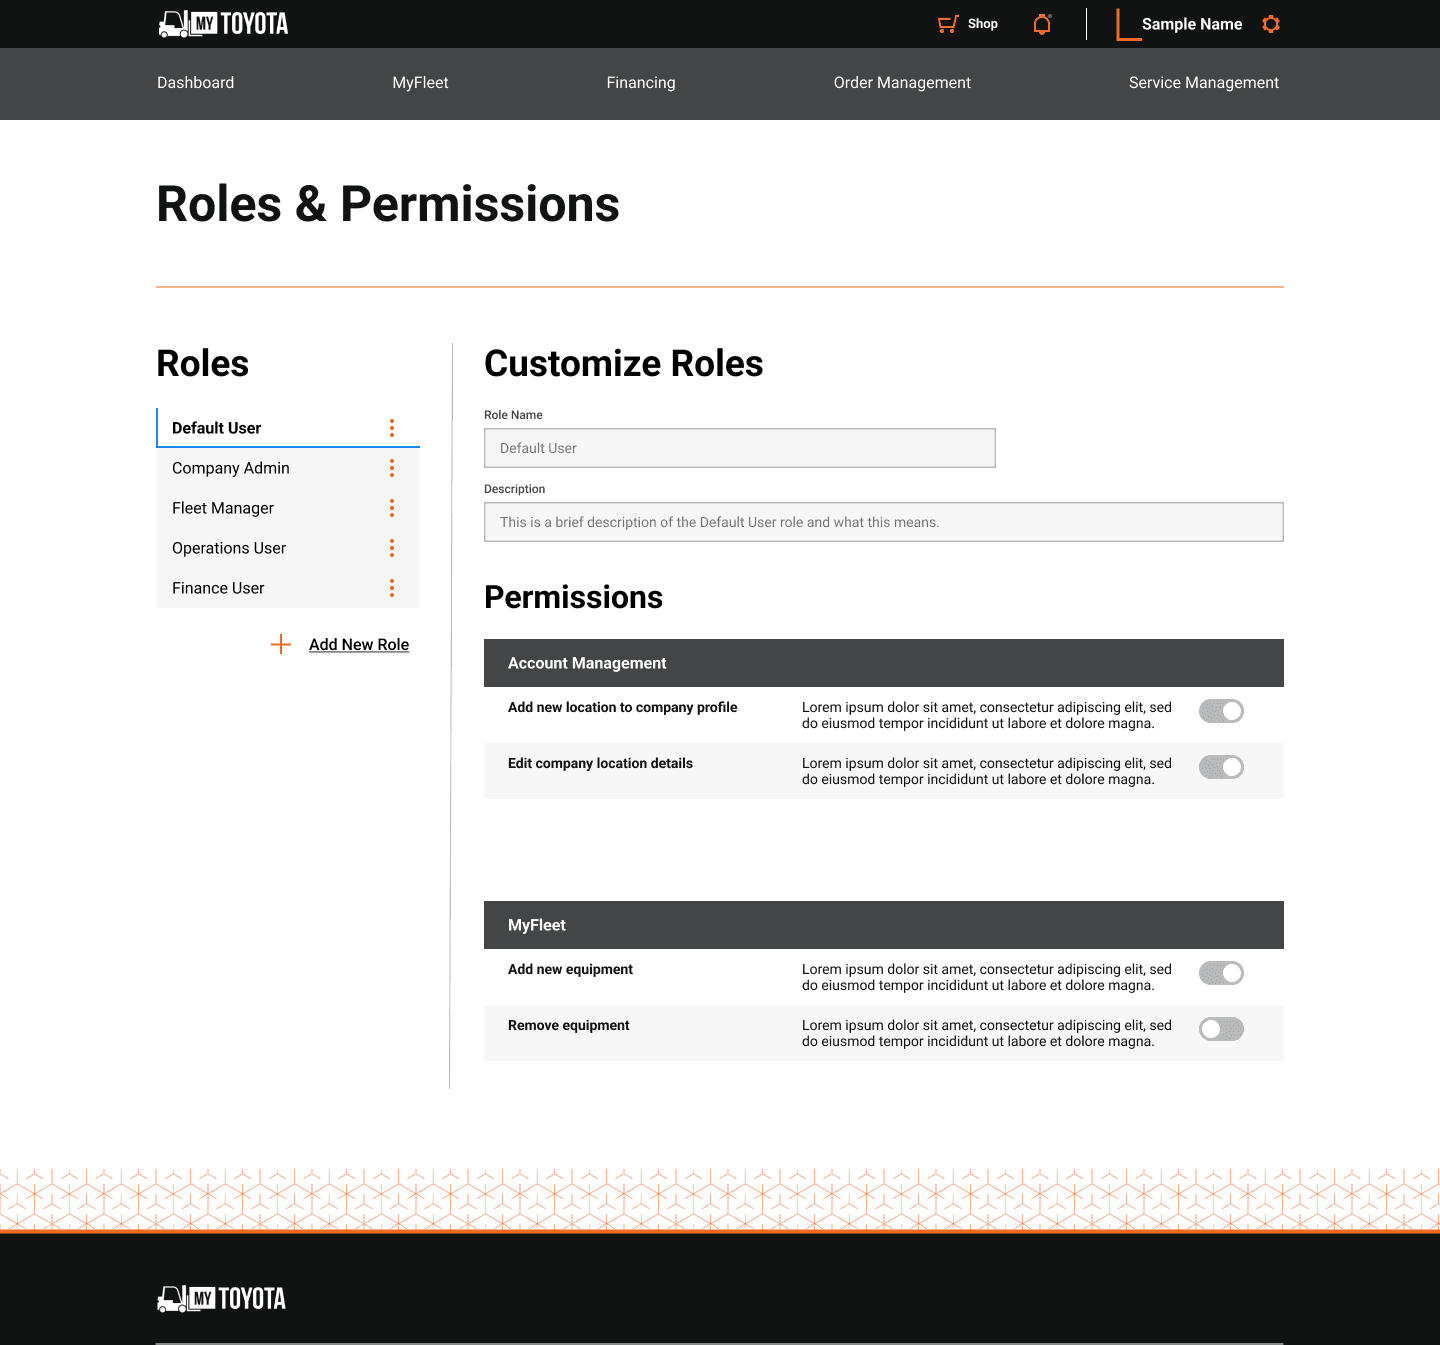
Roles + permissions
Results
+50%
in forklift utilization
Some forklifts got lost in the mix. With the portal, users were able to track lost forklifts and use them.
↑ efficiency
Reduction of manual labor led to easier organization.
Happy customers
Dealers were able to contact customers easier, leading to customer satisfaction
Considerations
If we interviewed more dealers and customers, would that change the different kinds of insights and data that would be desired?
Next case study